


Why Gut Feeling Costs You Money in Golf Markets
I spent my first two years betting on golf the way most people do — reading previews, backing names I recognised and convincing myself that watching every Sunday broadcast gave me an edge. My annual return was negative by roughly 12%. I was not unlucky. I was undisciplined, and the bookmakers’ margin punished every lazy selection I made.
The average sportsbook win rate hit a record 9.7% in 2025, which means that for every hundred pounds wagered across the market, operators kept nearly ten before the punter saw a penny of return. That margin is baked into every outright golf price you see. It is not a fee you can avoid; it is a tax on imprecision. The only way to overcome it is to be right more often than the price implies, or to find spots where the price is wrong. Both of those require a system, not a hunch.
A golf betting strategy is not a collection of tips. It is a repeatable decision-making framework that converts raw information into a probability estimate, then compares that estimate against the market price. When your estimated probability is higher than the implied probability of the odds on offer, you have identified value. When it is lower, you pass. That binary discipline — bet or skip — is the entire game. Everything else is just the machinery that feeds into that decision.
What makes golf uniquely suited to a structured strategy is the depth of available data. No other betting sport generates the volume of granular, player-level performance metrics that golf does. Every shot on a PGA Tour course is tracked, categorised, and published. The challenge is not finding data — it is knowing which data to trust and which to ignore. Over nine years of building and refining my own approach, I have settled on a framework built around three analytical pillars, a probability conversion layer and a tournament-selection filter. This article lays out each component in enough detail that you can build your own version and start applying it this week.
Three Pillars of Golf Analysis That Actually Predict Results
Before the 2026 Masters, Lewis Knowles at Betway revealed that Bryson DeChambeau had attracted 16% of all their outright bets on the tournament — more than any other player in the field. That number tells you everything about how the casual market operates. DeChambeau is a compelling personality, a viral content machine, and a genuinely elite golfer. But 16% of the handle on a single player in a 90-man field is not analysis — it is narrative bias doing what narrative bias always does: concentrating money on the story rather than the data.
My framework is built to counter exactly that impulse. It rests on three pillars, each of which contributes an independent signal to the final probability estimate.
The first pillar is course fit — the degree to which a golfer’s specific skill profile matches the demands of the host venue. Every golf course tests a different combination of abilities. A long, open links course rewards driving distance and wind management. A tight, tree-lined parkland course rewards accuracy off the tee and precision on approach shots. A course with small, undulating greens rewards putting touch and short-game creativity. Course fit analysis maps these venue demands against each player’s statistical profile to identify golfers whose strengths align with what the course rewards. When I break down a venue for the first time, I look at the scoring distribution by hole type — par threes, par fours, par fives — and identify which Strokes Gained categories drive performance on those holes. A detailed walkthrough of how to build a course fit model for golf betting is available if you want to go deeper into the methodology.
The second pillar is current form, measured across the most recent four to eight tournaments rather than the full season. Golf form is cyclical. Players peak, plateau, and decline in waves, often tied to injury recovery, equipment changes, or the mental grind of consecutive weeks on tour. I weight the last four events most heavily and the prior four as supporting context. A golfer who has gained strokes in three of his last four starts carries stronger form signal than one who posted a single brilliant result eight weeks ago followed by three missed cuts.
The third pillar is course history — how a player has performed at the specific venue in previous visits. Course history is the most overrated and most misapplied factor in golf betting. A strong historical record at a course can indicate genuine compatibility, but it can also reflect small-sample randomness. I use course history as a tiebreaker rather than a primary driver. If two golfers rate equally on course fit and current form, a strong course history for one of them nudges that player ahead. I never elevate a poor-form, poor-fit player into a selection purely because he finished sixth here two years ago. That road leads to the same narrative trap that put 16% of the money on DeChambeau.
The weighting I apply is roughly 50% course fit, 30% current form, and 20% course history. Those proportions are not fixed — they shift depending on how distinctive the course is. A highly unusual venue like Augusta National or TPC Sawgrass amplifies the course fit weight because specialist skills matter more. A generic parkland course with no distinguishing features flattens the course fit signal and elevates current form.

Using Strokes Gained to Separate Signal From Noise
I remember the exact week I stopped using traditional golf statistics for betting. It was early 2019, and I had backed a player who led the PGA Tour in greens in regulation — a stat that sounds like it should predict success. He missed the cut by four shots at a course where scrambling and putting mattered far more than hitting greens. Greens in regulation told me what he did on average across every course. It told me nothing about what he would do at that specific course that week. I needed a metric that measured how much a player gained or lost relative to the field, broken into the components that actually mattered. That metric is Strokes Gained.
The PGA Tour adopted Strokes Gained as an official statistic in 2011, and expanded it into sub-categories — Off-the-Tee, Approach, Around-the-Green and Putting — from 2016 onwards. The data is collected by ShotLink, a tracking system that uses a network of radars, lasers and cameras positioned around every PGA Tour course to measure the exact position of every shot hit during competition. The result is the most granular performance dataset in professional sport. Every drive, every iron, every chip, every putt is logged, geo-located and compared against the field average from that position.
What makes Strokes Gained superior to traditional stats for betting purposes is that it is comparative and context-adjusted. A fairway hit from a wide-open tee box on a par five is not equivalent to a fairway hit from a narrow, tree-lined par four. Traditional fairways-hit percentage treats them the same. Strokes Gained does not — it measures the value of the outcome relative to where the shot was played from and what the field averaged from that same zone. A player who gains 0.8 strokes per round on approach shots is producing approach play that is 0.8 shots better than the field average every time he plays eighteen holes. Over four rounds, that compounds to 3.2 strokes of advantage in a single skill category.

For betting, the four sub-categories have very different predictive values. Strokes Gained: Approach is the most stable and most predictive. Iron play from 100 to 225 yards reflects genuine, repeatable skill and is less influenced by course setup, weather or day-to-day variance than driving or putting. Strokes Gained: Off-the-Tee is moderately stable but heavily course-dependent — it matters enormously at Torrey Pines and barely registers at Harbour Town. Strokes Gained: Around-the-Green fluctuates more week to week because it depends on the types of lies and green surrounds a course presents. And Strokes Gained: Putting is the noisiest of the four — putting performance varies dramatically from week to week, even for elite putters, because green surfaces and stimp speeds differ wildly between venues.
My practical approach is straightforward. For any given tournament, I identify which one or two SG categories the course demands most. A long, punishing course like Bethpage Black rewards Off-the-Tee and Approach. A short, technical course like Harbour Town rewards Approach and Around-the-Green. I then filter the field for players who rank in the top quartile of the relevant SG categories over their last twelve to twenty rounds. That filter typically reduces a 156-player field to thirty or forty candidates. From there, I apply the course fit and form pillars to narrow further.
The common mistake is to aggregate all four SG categories into a single “Total Strokes Gained” number and use that as the ranking metric. Total SG tells you who is playing the best golf overall, but it does not tell you who is playing the right type of golf for this course this week. A player who ranks first in total SG but gains most of his strokes through putting on bermuda greens is not a strong candidate at a tournament played on poa annua surfaces. Specificity is everything.

Implied Probability and the Art of Spotting Value
Every price on a golf betslip is a probability estimate wearing a costume. Strip away the fractional format and what remains is the bookmaker’s assessment — adjusted by margin — of how likely that golfer is to win. Understanding that translation is the single most important skill in golf betting strategy, because it turns a subjective “feel” for value into an objective comparison.
The conversion formula is simple. For fractional odds of A/B, the implied probability equals B divided by (A + B), then multiplied by 100 to express as a percentage. A golfer priced at 30/1 has an implied probability of 1 divided by 31, which is 3.23%. A golfer at 10/1 implies 9.09%. A pre-tournament favourite at 6/1 implies 14.29%. These percentages tell you what must be true for the bet to break even over the long run. If you back a 30/1 shot repeatedly, you need that player to win more than 3.23% of the time to generate a positive return.
The catch is that the sum of all implied probabilities in a golf outright market does not equal 100%. It exceeds it, typically by 20 to 40 percentage points in a full-field event. That excess is the overround — the bookmaker’s built-in margin. An overround of 130% means the operator has priced the market as if there are 1.3 winners in every tournament, which is obviously impossible. The extra 30% is profit extracted from every bettor in the market. To find the “true” implied probability of any selection, you need to adjust for the overround by dividing each player’s raw implied probability by the total market percentage. In practice, most punters skip this step and compare their own probability estimate directly against the raw implied figure, accepting the overround as a cost of doing business.
Value exists when your estimated probability of a golfer winning exceeds the implied probability of the odds. Suppose your analysis — built on the three pillars — assigns a 6% chance to a golfer priced at 30/1 (implied 3.23%). The difference between your 6% and the market’s 3.23% is positive expected value. If your model is accurate, this bet will profit over many repetitions. If the same golfer is priced at 12/1 (implied 7.69%), your 6% estimate is below the breakeven threshold and the bet is negative expected value. The price looks shorter, the golfer looks more likely to contend — but the maths says pass.
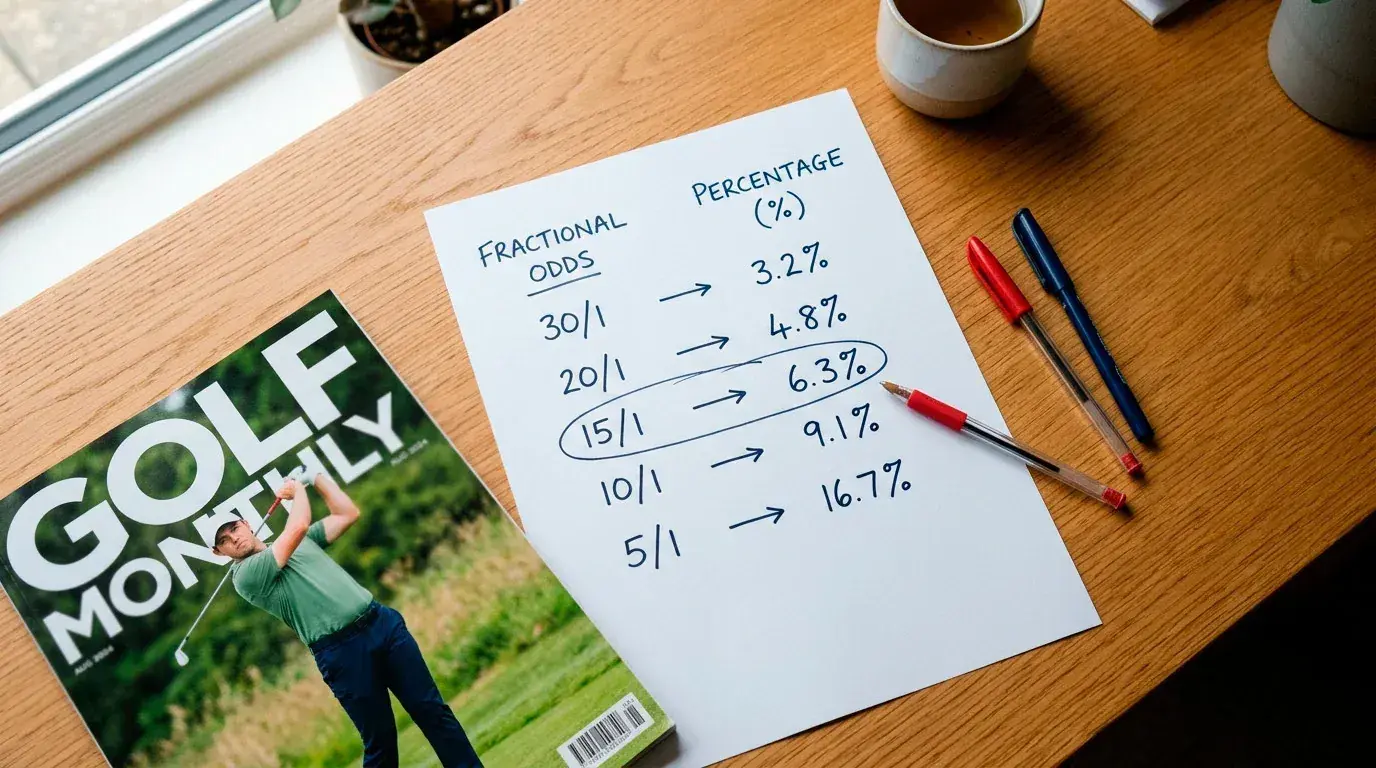
Building accurate probability estimates is the hard part, and it is where the three pillars come in. I convert my pillar analysis into a rough ranking of every player in the field, then assign probability estimates using a power model — a mathematical function that distributes probability non-linearly based on rank, with the top-ranked players receiving disproportionately higher estimates. The exact parameters of that model are calibrated against historical data, but the principle is accessible to anyone: rank the field, estimate probabilities, compare against the market, bet only where your number is higher.
One pitfall to flag: value is a long-term concept. A single bet with positive expected value can still lose, and it will lose more often than it wins when the implied probability is in the low single digits. You need volume and discipline to realise the edge. Betting one value selection per week and expecting to profit after a month is not a strategy — it is a lottery ticket with a spreadsheet attached. The framework produces results across a full season of forty-plus events, not across four weekends.
Field Strength and Tournament Selection as a Betting Edge
One of the best bets I ever placed was on a mid-tier player at a weak-field event in the autumn. He was priced at 28/1, which seemed about right if you judged him against a typical PGA Tour field. But that week’s field was missing most of the top thirty players in the world, and his competition was significantly thinner than usual. Against that field, his true probability of winning was closer to 6% than the implied 3.4%. He finished second — I was on each-way — but the principle held. Field strength is the most underused lever in golf betting.
Not all tournaments are created equal, and the betting market does not always adjust prices proportionally. A major championship attracts the deepest field in golf: 156 players, nearly all of them ranked inside the world’s top five hundred, with the top fifty almost universally present. A regular-season PGA Tour event might feature eight of the top twenty in the world, leaving gaps in the quality curve. An opposite-field event or an early-season event in a less desirable location can be missing the majority of elite players altogether.
The impact on betting value is direct. When the field is weaker, the probability of any given mid-tier player winning increases because the number of genuinely superior competitors decreases. Bookmakers adjust their prices to reflect this — a player who might be 50/1 at a major could be 20/1 at a weak-field event. But the adjustment is often incomplete. Operators anchor on the player’s overall world ranking and recent form without fully accounting for the specific composition of that week’s field. That gap between the adjusted price and the true field-adjusted probability is where you find value.
The contrast between tours makes this even more pronounced. Wagering volume on PGA Tour events runs approximately 100 times higher than on LIV Golf events, which means PGA Tour prices are shaped by vastly more market activity and are therefore more efficient. DP World Tour events and Korn Ferry Tour events sit somewhere in between — less liquid than PGA Tour, more liquid than LIV. Lower liquidity means less price discovery, which means more opportunity for a prepared bettor. I allocate a disproportionate share of my bankroll to mid-tier events precisely because the market is softer.
To evaluate field strength quickly, I use a simple metric: the sum of the Official World Golf Ranking points of the top thirty players in the field. Majors and signature events score above 3,000 on this metric. Average tour events score between 1,500 and 2,500. Weak-field events fall below 1,000. When the score drops below 1,500, I start looking for mid-ranked players whose prices have not fully adjusted downward to reflect the thinner competition. It is a blunt instrument, but it consistently identifies weeks where the market is ripe for value.

A Pre-Tournament Research Workflow You Can Run in Thirty Minutes
Theory without a process is just an interesting conversation. Here is the exact workflow I run every Tuesday, when outright prices for the coming week’s tournament are first published by most UK operators. The entire process takes about thirty minutes once you have the data sources bookmarked, and it produces a shortlist of three to five selections with positive expected value.
Step one: identify the course demands. I pull up the tournament venue’s scorecard and any available course guide. I note the total yardage, the par breakdown (how many par threes, fours and fives), the rough height and width of fairways reported in pre-tournament coverage, and the green size and speed if available. From those raw inputs, I determine which two Strokes Gained categories the course prioritises. A long course with wide fairways and large greens points to Off-the-Tee and Approach. A short course with tight fairways and small greens points to Approach and Around-the-Green. If the course has hosted the same event before, I check historical scoring data to confirm which skill profiles have thrived.
Step two: filter the field. Using the relevant SG categories from step one, I rank every player in the field by their performance in those specific categories over the last twelve to twenty competitive rounds. I use publicly available data from sites that aggregate PGA Tour statistics — DataGolf and the PGA Tour’s own stat portal are the two I rely on most. The filter is simple: any player not in the top 40% of the field for the primary SG category is eliminated. This usually cuts the 156-man field to about fifty or sixty players.
Step three: apply current form. Within the filtered group, I rank players by their total Strokes Gained over the last four starts. Players trending upward (gaining more strokes in their most recent event than their four-start average) get a form boost. Players with a withdrawal or missed cut in their last two starts get a form penalty unless the reason was clearly non-performance-related (weather, injury withdrawal on the first day).
Step four: check course history. For any players who have played the venue before, I note their finishing positions and strokes gained relative to the field in those previous appearances. Strong course history (two or more top-twenty finishes) elevates a player’s ranking slightly. Weak course history does not eliminate a player — it simply receives less weight than the other pillars.
Step five: compare against the market. I convert the top fifteen players from my ranked list into estimated probabilities using a simple power curve. Then I pull the current outright odds from two or three UK operators and calculate the implied probabilities. Any player whose estimated probability exceeds the implied probability by at least 1.5 percentage points enters my shortlist. Typically, that produces three to five names per week — sometimes fewer, occasionally none. When the shortlist is empty, I do not bet. That discipline is the workflow’s most important output.