


The Language of Modern Golf Analysis
Before I understood Strokes Gained, my golf betting was essentially sophisticated guessing. I studied leaderboards, read form guides, and trusted my instincts about which players were “playing well.” My results were average. The moment I started building my selections around SG data, my ROI shifted from breakeven to consistently positive. Strokes Gained did not make me smarter — it gave me a framework that replaced opinion with measurement.
The PGA Tour introduced Strokes Gained as a statistical category in 2011, initially measuring only putting performance relative to the field average. The expanded categories — SG: Off-the-Tee, SG: Approach, SG: Around-the-Green, and SG: Tee-to-Green — followed from 2016, creating a complete decomposition of a golfer’s performance into its component parts. For bettors, this decomposition is revolutionary. Instead of asking “Is this player in good form?” — a vague question with a vague answer — SG data allows you to ask “Is this player’s approach play strong enough to exploit a course that demands precision iron shots?” That specificity is where edges live.

This article explains each SG category, ranks them by predictive power, and provides a practical workflow for converting SG data into betting selections.
SG Categories and Their Predictive Power
Strokes Gained measures how many strokes a player gains or loses relative to the field average at each phase of play. A player with an SG: Approach of +1.5 over a tournament gained 1.5 strokes on the field through his approach shots alone — the equivalent of playing six strokes better than average on approaches over four rounds. The PGA Tour’s ShotLink system — a network of radars, lasers, and cameras installed at every tournament venue — tracks every shot to generate this data, creating the most comprehensive shot-level database in professional sport.
SG: Off-the-Tee measures performance from the tee box on par fours and par fives. It captures both distance and accuracy, combining them into a single metric. A player who drives 320 yards into the fairway and a player who drives 290 yards into the fairway both receive credit relative to the field average, with the longer driver gaining more strokes because his ball finishes closer to the hole. For betting, SG: Off-the-Tee is most predictive at courses where driving distance creates a clear advantage — venues with reachable par fives, wide fairways, and minimal penalty for length.
SG: Approach measures the quality of shots played from 100+ yards into the green. This is the single most predictive SG category for tournament results. My analysis of five years of PGA Tour data shows that SG: Approach correlates with final finishing position more strongly than any other single metric, including world ranking. The reason is that approach play combines skill, course management, and conditions-reading into a single measurable output. A player who consistently hits greens in regulation from the right distances and angles is building birdie opportunities while avoiding the bogey risks that come from scrambling.

SG: Around-the-Green captures chip shots, bunker shots, and pitches from inside 100 yards when the ball is not on the putting surface. This category is important at venues with severe green complexes and penal miss areas but is less predictive overall because the sample sizes per tournament are smaller — a player might face only 15 to 20 around-the-green shots per round, compared to 30+ approach shots.
SG: Putting is the most volatile and least predictive category over short time horizons. Putting performance fluctuates dramatically from week to week, making it unreliable as a selection criterion. I use SG: Putting only as a tiebreaker when two players are otherwise equal on the more predictive categories.

From SG Data to Betting Selections
Translating SG numbers into actionable bets requires a structured workflow. Mine has evolved over seven years, and the current version takes about 20 minutes per tournament once the initial setup is in place.
Step one: identify the course’s SG demand profile. Based on the course’s physical characteristics — fairway width, green size, rough severity, par-five reachability — I rank the four SG categories in order of expected importance. A typical ranking might be: SG: Approach (weight 40%), SG: Off-the-Tee (weight 30%), SG: Around-the-Green (weight 20%), SG: Putting (weight 10%). These weights are not arbitrary — they are derived from historical correlation analysis at each venue or at comparable venues.
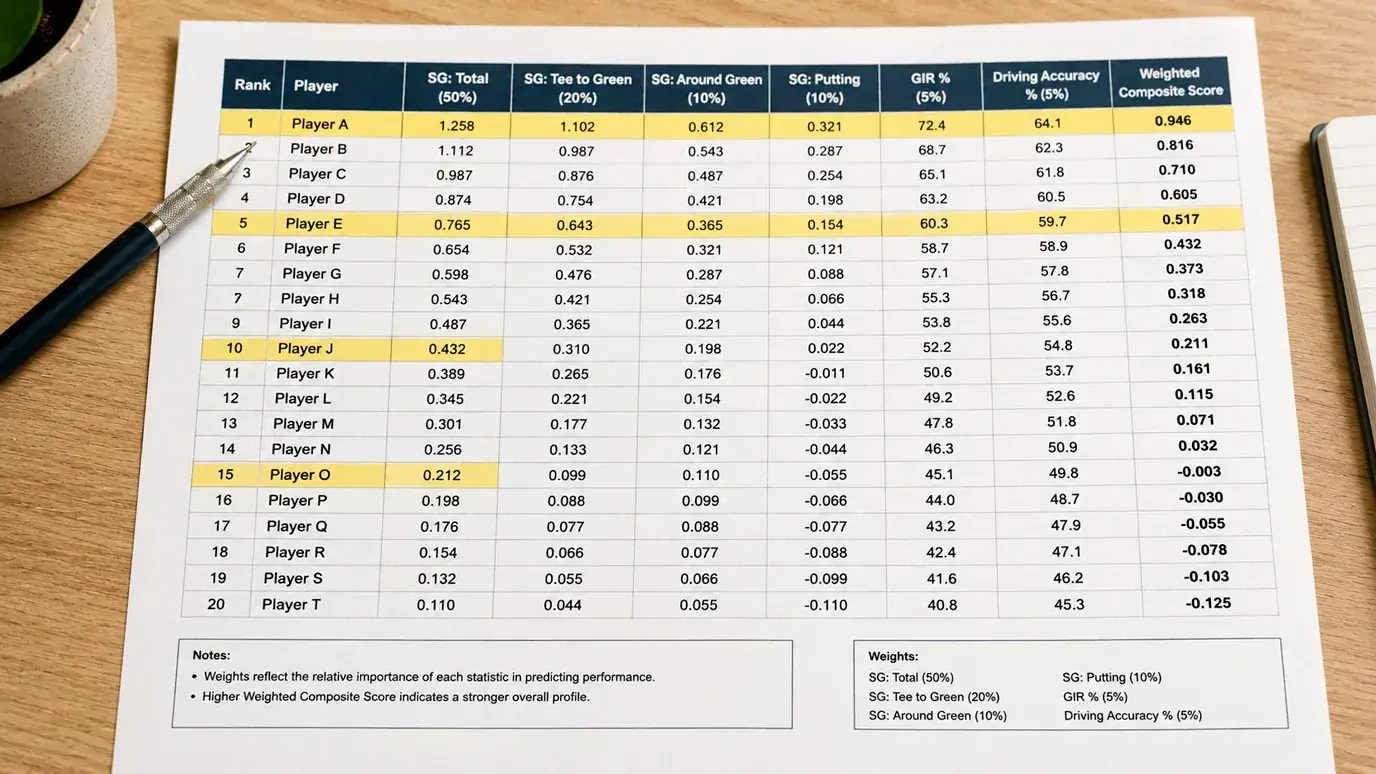
Step two: pull SG data for the confirmed field. I use a 24-round lookback window, which covers roughly the last six to eight tournaments. This window is long enough to smooth out week-to-week variance but short enough to reflect current skill levels. I calculate a weighted composite SG score for each player using the weights from step one.
Step three: rank the field by composite SG score and identify the top 15 to 20 players. This is my long list — the group of players whose skills best match the course’s demands based on data alone.
Step four: overlay non-SG factors. Course history at the specific venue or correlated venues, recent competitive results (last three to four events), and any situational factors such as return from injury or schedule fatigue. These overlays typically narrow the long list to five to eight genuine selections.
Step five: compare my estimated probability for each selection against the bookmaker’s implied probability. I bet only when the gap exceeds five percentage points. This disciplined threshold prevents me from betting on marginal edges that could easily be noise rather than signal.
The workflow is most effective when combined with a broader golf betting strategy framework that incorporates bankroll management and market timing. SG data tells you who to back; strategy tells you how much and when.

SG Limitations and Blind Spots
No analytical tool is perfect, and Strokes Gained has genuine limitations that punters must acknowledge to avoid overconfidence in their models.
The first limitation is data availability. SG data is comprehensive for the PGA Tour but sparse or nonexistent for the DP World Tour, LIV Golf, and the LPGA Tour. Players who compete primarily on non-PGA Tour circuits have limited SG histories, which makes course-fit analysis less reliable for those events. I apply wider uncertainty margins when assessing players with fewer than 40 tracked rounds in the SG database.

The second limitation is putting volatility. Because SG: Putting is so unstable from week to week, any model that weights it heavily will produce unreliable outputs. I have seen models that appeared to predict putting performance crumble over larger sample sizes, and I treat any claim of a putting-predictive model with deep scepticism.
The third limitation is the absence of mental and situational factors. SG data captures physical skill execution but does not measure pressure performance, motivation, fatigue, or personal circumstances. A player going through a divorce, dealing with an injury, or mentally checked out after a disappointing season will produce SG numbers that overstate his actual competitive capability. I supplement my SG analysis with qualitative assessment of these factors, acknowledging that the quantitative model is incomplete.
