


The Edge That Hides in Plain Sight
Four years ago, I backed a player at 80/1 for a mid-season PGA Tour event that nobody was paying attention to. He was ranked 65th in the world, coming off a missed cut, and the market had written him off. But my course-fit analysis told a different story: the venue demanded precision approach play on bentgrass greens, and his SG: Approach numbers on bentgrass ranked inside the top 10 on tour. He won by three strokes. That bet crystallised what I had been learning through years of trial and error — course fit is the single most undervalued variable in golf betting.

The PGA Tour has tracked Strokes Gained data since 2011, with expanded categories available since 2016. That data infrastructure makes course-fit analysis accessible to anyone willing to invest the time, yet the betting market consistently underweights it. Traders and casual punters alike default to recent form and world ranking as their primary inputs, which means players whose skills happen to match a specific course’s demands are frequently underpriced. My own tracking shows that course-fit-driven selections produce a higher ROI than any other single selection criterion, including current form and course history.
Course fit is not a vague concept about a player “liking” a course. It is a data-driven process of matching measurable player skills to quantifiable course demands. This article walks through how I profile a course, identify correlating venues, and apply the results to my selection process.
Profiling a Golf Course for Betting
Every golf course has a statistical fingerprint — a combination of physical and strategic characteristics that reward certain skills and punish others. My profiling process begins with five core variables that I pull from course guides, tournament history, and the ShotLink system that tracks every shot on the PGA Tour using radars, lasers, and cameras.
The first variable is fairway width. Narrow courses (average fairway under 28 yards) elevate the importance of driving accuracy. Wide courses shift the emphasis toward driving distance. The second is green size and complexity. Small, heavily contoured greens demand precision iron play and elevate SG: Approach as the dominant category. Large, relatively flat greens reduce the approach-shot penalty and shift value toward putting and short-game skill. Third, rough severity: thick, penal rough amplifies the cost of missing fairways and greens, making accuracy-based metrics more predictive. Light rough reduces that penalty and allows aggressive players to recover more easily.

Fourth, I assess the par-five structure. Courses with reachable par fives reward long hitters disproportionately, because two-putt birdie opportunities on par fives are the primary driver of under-par scoring. Courses with unreachable par fives neutralise the distance advantage and reward consistency across all holes. Fifth, I look at prevailing conditions: wind exposure, green speed, and firmness. A tree-lined inland course plays very differently from an exposed coastal track, even if the yardage and fairway widths are similar on paper.
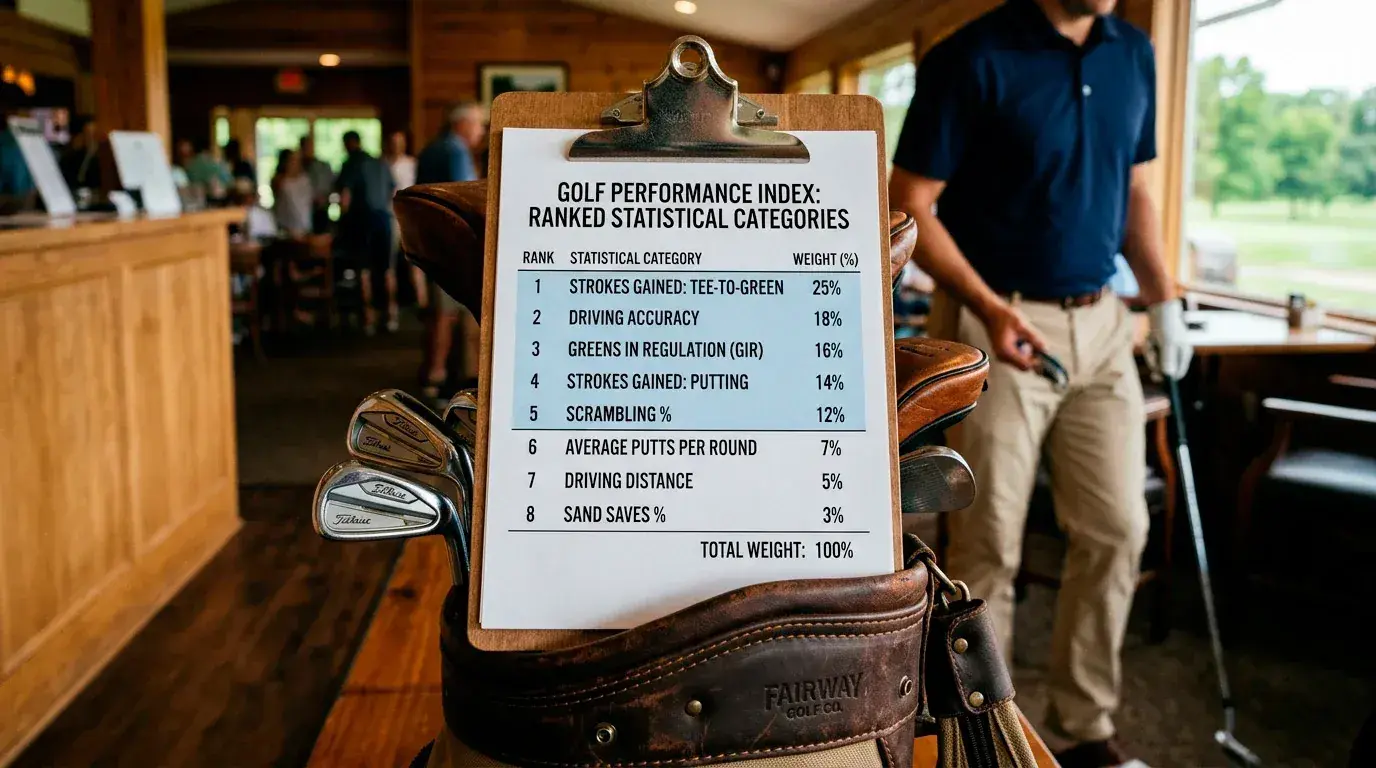
Once I have these five variables mapped, I rank the Strokes Gained categories in order of expected importance for the venue. A typical output might look like: SG: Approach (1st), SG: Off-the-Tee accuracy (2nd), SG: Around-the-Green (3rd), SG: Putting (4th). That ranking becomes the filter I apply to the field when identifying selections.
Course Correlations and Similar Venues
IC360’s co-CEO Scott Sadin once described his company’s role as “providing world-class technology and expert services” to protect sporting integrity, and the data infrastructure that supports integrity monitoring is the same infrastructure that enables course-correlation analysis. The depth of shot-level data available on the PGA Tour — every shot tracked, measured, and categorised — allows punters to identify statistical relationships between courses that share similar demand profiles.
Course correlation measures how strongly a player’s performance at one venue predicts his performance at another. Two courses with similar yardage, fairway width, green size, and rough severity will tend to produce correlated results — players who perform well at one will disproportionately perform well at the other. I maintain a correlation matrix of approximately 30 PGA Tour venues, updated annually, that shows the strength of these relationships.
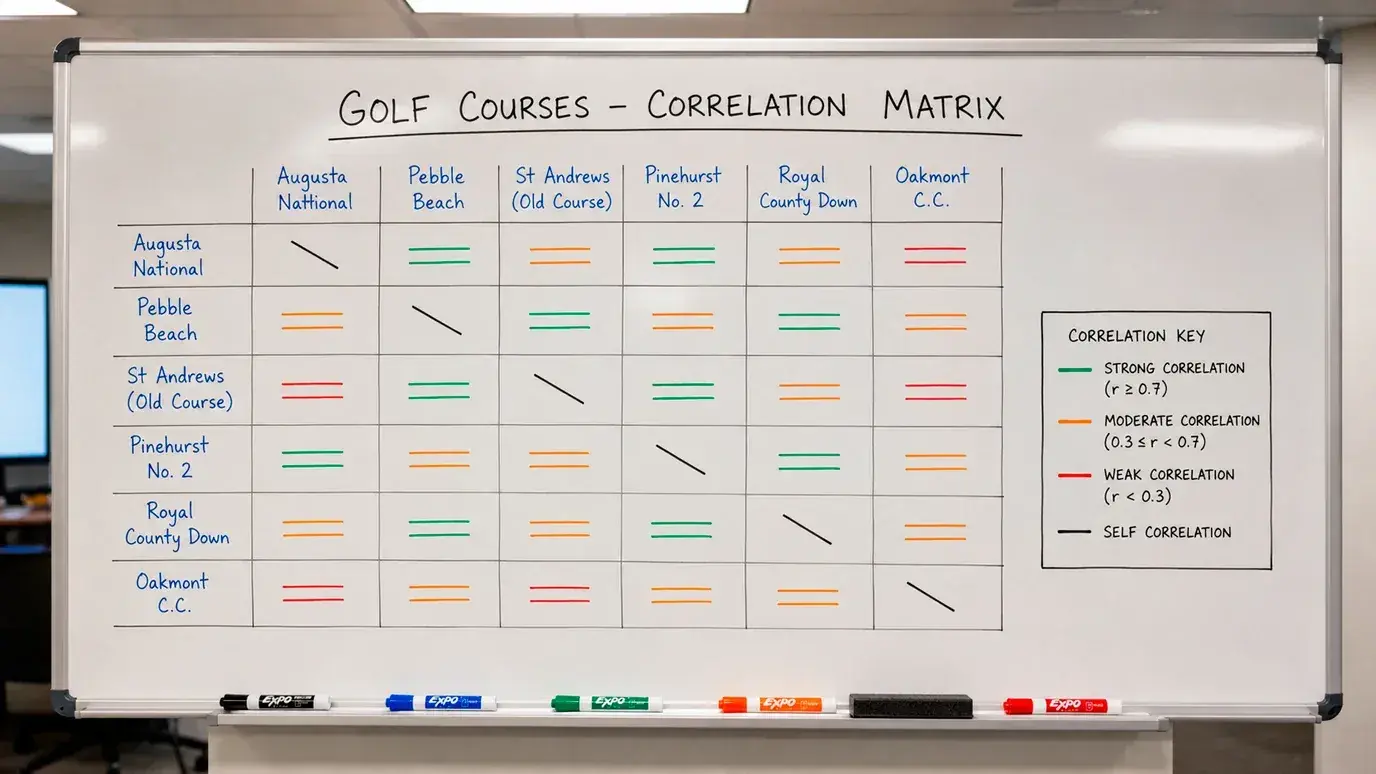
The practical application is powerful. If the PGA Tour visits a course for which I have limited direct data — perhaps it is a new venue or one that has been redesigned — I identify the two or three most strongly correlated courses in my matrix and use player performance at those courses as a proxy. This approach saved me during a tournament at a completely unfamiliar venue: I identified a strong correlation with two courses I knew well, filtered the field through those proxy results, and landed a 33/1 each-way winner whose course-fit profile was invisible to punters relying solely on recent form.
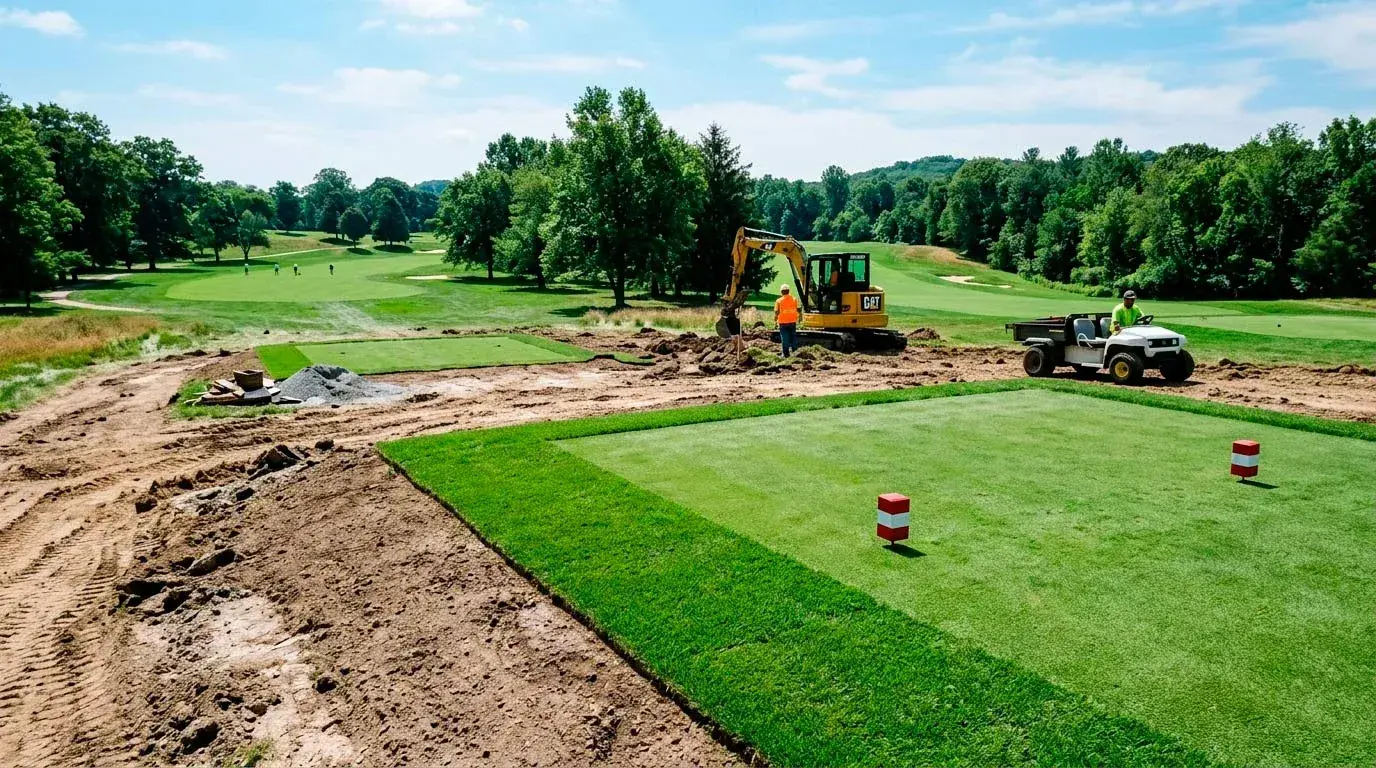
A word of caution: course correlations break down when a venue undergoes significant redesign. New tees, altered green complexes, or changes to fairway bunkering can shift a course’s statistical fingerprint enough to invalidate historical correlations. I always check whether a venue has been modified since the last tournament it hosted before applying historical Strokes Gained data from previous editions.
Applying Course Fit to Your Selections
The application step is where course-fit analysis translates into actual betting decisions, and it requires discipline to avoid the temptation of overcomplicating the process.
My workflow takes approximately 30 minutes per tournament. I start by profiling the course and ranking the SG categories as described above. Then I pull the field’s SG data for the top-ranked categories over the last 24 rounds and sort the players by their composite score. The top 15 to 20 players on this composite ranking form my long list. From that long list, I check course history (previous results at the same venue or at strongly correlated venues), current form (last four to six tournaments), and the player’s trajectory (improving, stable, or declining). I eliminate anyone whose current form is clearly declining or whose most recent tournament performance was significantly below their baseline.
The survivors — typically five to eight players — are my short list. I compare their outright, top-finish, and each-way prices against my estimated probabilities, and I bet on any selection where my estimated probability exceeds the bookmaker’s implied probability by five percentage points or more. That five-point threshold is deliberate: it provides a buffer for model error and ensures I am only betting when the edge is meaningful rather than marginal.
The discipline I mentioned is resisting the urge to back a player who looks like a great course fit but whose price offers no value. Course fit identifies likely performers, but value identification determines whether the bet is worth placing. The best course fit in the field at a price of 10/1, when my model says 12/1 is fair, is a pass. The third-best course fit at 50/1, when my model says 35/1 is fair, is a strong bet. Separating the analysis phase from the betting phase is the key to making course fit work as a long-term profit driver.